Difference between revisions of "Bollinger bands"
Jump to navigation
Jump to search
(Created page with "A technical indicator used by traders to measure market volatility consisting of three lines plotted at standard deviation levels above and below a centre line. == Sources: == https://fintechmagazine.com/financial-services-finserv/140-blockchain-and-crypto-words-ultimate-z-glossary Category:Glossary") |
(images added) |
||
| Line 1: | Line 1: | ||
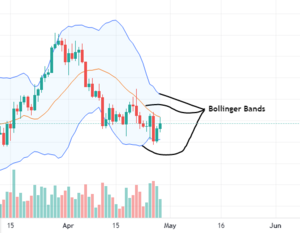
[[File:Bollinger bands.png|thumb|What Bollinger Bands look like]] | |||
A technical indicator used by traders to measure market volatility consisting of three lines plotted at standard deviation levels above and below a centre line. | A technical indicator used by traders to measure market volatility consisting of three lines plotted at standard deviation levels above and below a centre line. | ||
Revision as of 15:26, 28 April 2022
A technical indicator used by traders to measure market volatility consisting of three lines plotted at standard deviation levels above and below a centre line.
